Code Snippet: MATLAB Plot Colors
This function returns a matrix whose rows are color vectors that can be used when plotting multiple lines in MATLAB. You can replace this set of colors with whatever RGB colors you’d like and you can add more too if you want.
function C = get_plot_colors(N,M)
% RGB sets
C = ...
[000, 000, 000;
255, 000, 000;
000, 000, 255;
000, 145, 010;
255, 000, 255;
243, 109, 004;
118, 042, 131;
000, 169, 183;];
[MAX_N,~] = size(C);
if nargin < 1
N = MAX_N;
end
if nargin < 2
M = 1;
end
if N > MAX_N
warning(['N cannot be greater than ' num2str(MAX_N) '. Setting N=' num2str(MAX_N) '.']);
N = MAX_N;
end
if M < 1
M = 1;
end
% Take first N and normalize to [0,1]
C = C(1:N,:) ./ 255;
% Repeat scheme M times
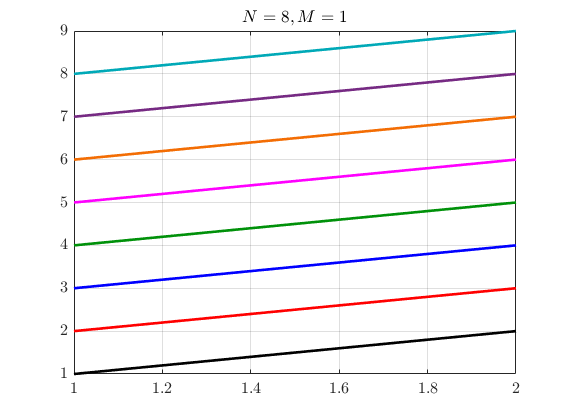
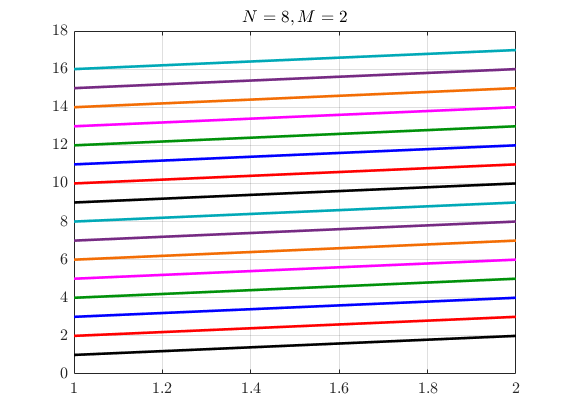
C = repmat(C,M,1);To test this you can run the following.
C = get_plot_colors(N,M);

N = length(C(:,1));

x = (1:N);
y = (2:N+1);
A = [x; y;];
figure(101);
for i = 1:N
    plot(A(:,i),'Color',C(i,:)); hold on;
end
grid on;
hold off;